Local
Scale: The Virunga Mountains
The data sets in this section all relate to the local
situation around the Virunga Mountains. Several different
types of data from several different sources are given,
but they are not all coregistered. These data sets are so
diverse that it would be impractical to present all of
the map combinations that would be useful in
understanding the problems around the Virunga Mountains.
Having been shown examples of coregistered data sets in
the previous two sections, it is left to you, the
researchers, to find useful ways of combining the data in
this section into your own GIS stacks. Some directions
and suggested combinations will be given in the Remote Sensing Activities
section. As in the Continental
and Regional Scale sections, view the individual maps and
images using your net browser by clicking on the
thumbnail of the map. Download any of the maps by
clicking on "download TIFF" and then use NIH
Image or similar program for manipulation.
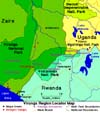 Political Map (download
TIFF) This map shows principal roads, locations of
towns, national boundaries, rivers and lakes, and the
names of the volcanoes in the Virunga range. It also
shows the location of the boundaries established in 1925
for the national park. When it was first created, the
park was under Belgian and British control. Later, when
Rwanda, Congo (formerly Zaire), and Uganda gained
independence in the early 1960s, the park was split into
three sections. Use and/or preservation of the area was
divided between three governments, each with its own
problems and policies. The map also shows the locations
of several refugee camps set up in Congo (formerly Zaire)
in summer and fall 1994 when 2 million Hutu fled Rwanda
to escape the victorious Tutsi armies. Kibumba was the
largest of these camps, containing in excess of 200,000
refugees. The land around Kibumba is barren volcanic
rock. Between 1994 and 1996, the refugees depended on
international charities for food, and on the forest on
the slopes of the nearby active volcano Nyiragongo for
fuel and building materials. Political Map (download
TIFF) This map shows principal roads, locations of
towns, national boundaries, rivers and lakes, and the
names of the volcanoes in the Virunga range. It also
shows the location of the boundaries established in 1925
for the national park. When it was first created, the
park was under Belgian and British control. Later, when
Rwanda, Congo (formerly Zaire), and Uganda gained
independence in the early 1960s, the park was split into
three sections. Use and/or preservation of the area was
divided between three governments, each with its own
problems and policies. The map also shows the locations
of several refugee camps set up in Congo (formerly Zaire)
in summer and fall 1994 when 2 million Hutu fled Rwanda
to escape the victorious Tutsi armies. Kibumba was the
largest of these camps, containing in excess of 200,000
refugees. The land around Kibumba is barren volcanic
rock. Between 1994 and 1996, the refugees depended on
international charities for food, and on the forest on
the slopes of the nearby active volcano Nyiragongo for
fuel and building materials.
Next we have a series of Landsat images
taken over a period of nearly 20 years. The first four
images show the complete original image, but they are
reduced in size to about one tenth the original for
efficiency in downloading and viewing. Each of these
images is about 185 km across and shows a larger area
than does the Political Map above. The rest of the images
show medium-to-small sections of the originals. Most of
these images show areas smaller than the Political Map.
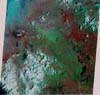 Eastern Rwanda, MSS bands
3-2-1 (download
TIFF) (MSS refers to a Landsat Multi-Spectral
Scanner; bands 3-2-1 mean that MSS spectral band 3
provides the red component of this composite image, band
2 provides the green component, and band 1 provides the
blue component.) This image was taken in February 1973.
It shows the eastern section of Rwanda, including the
swamp/lake district on the Tanzania border. In this
version, vegetation shows up in shades of red, while
savanna and bare ground show up in shades of green. The
eastern half of the Virunga Mountains are visible at the
left edge of the image. Clouds cover the Virungas and the
high central plateau of Rwanda. Eastern Rwanda, MSS bands
3-2-1 (download
TIFF) (MSS refers to a Landsat Multi-Spectral
Scanner; bands 3-2-1 mean that MSS spectral band 3
provides the red component of this composite image, band
2 provides the green component, and band 1 provides the
blue component.) This image was taken in February 1973.
It shows the eastern section of Rwanda, including the
swamp/lake district on the Tanzania border. In this
version, vegetation shows up in shades of red, while
savanna and bare ground show up in shades of green. The
eastern half of the Virunga Mountains are visible at the
left edge of the image. Clouds cover the Virungas and the
high central plateau of Rwanda.
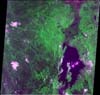
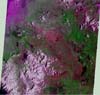 Eastern Rwanda, MSS bands
2-4-1 (download
TIFF) This is the same '73 image as above, only using
a different combination of spectral bands: band 2 in red,
band 4 in green, and band 1 in blue. In this band
combination, vegetation shows up in a familiar green, but
the savanna and bare ground show up in shades of purple.
Different band combinations are often used to make images
of the same scene because each band combination
emphasizes different surface and atmospheric features.
These two images can be stacked. Eastern Rwanda, MSS bands
2-4-1 (download
TIFF) This is the same '73 image as above, only using
a different combination of spectral bands: band 2 in red,
band 4 in green, and band 1 in blue. In this band
combination, vegetation shows up in a familiar green, but
the savanna and bare ground show up in shades of purple.
Different band combinations are often used to make images
of the same scene because each band combination
emphasizes different surface and atmospheric features.
These two images can be stacked.
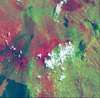
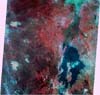 Western Rwanda, MSS bands
3-2-1 (download
TIFF) This image of western Rwanda and eastern Congo
(formerly Zaire) was taken in March 1975. Prominent hazes
cover the Congo Basin. The volcanic plume north of Lake
Kivu signals an eruption of the volcano Nyiragongo.
Vegetation appears in red. Western Rwanda, MSS bands
3-2-1 (download
TIFF) This image of western Rwanda and eastern Congo
(formerly Zaire) was taken in March 1975. Prominent hazes
cover the Congo Basin. The volcanic plume north of Lake
Kivu signals an eruption of the volcano Nyiragongo.
Vegetation appears in red.
 Western Rwanda, MSS bands
2-4-1 (download
TIFF) This image shows the 1975 scene in the second
set of bands. Notice that the haze and the volcanic plume
are less evident in this version than the 3-2-1 version.
This is because band 4, which is shown in green, is
farther out into the infrared part of the spectrum than
the other bands, and thus penetrates more easily through
any haze. These two images can be stacked. Western Rwanda, MSS bands
2-4-1 (download
TIFF) This image shows the 1975 scene in the second
set of bands. Notice that the haze and the volcanic plume
are less evident in this version than the 3-2-1 version.
This is because band 4, which is shown in green, is
farther out into the infrared part of the spectrum than
the other bands, and thus penetrates more easily through
any haze. These two images can be stacked.
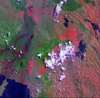
 Virunga Region, TM bands
3-2-1 (download
TIFF) This image was created from spectral bands
recorded by a Landsat Thematic Mapper (TM). TM bands
differ slightly from MSS bands. The image was taken in
July 1989 and shows about the same region as the
Political Map above. The 3-2-1 combination of TM bands
produces a (nearly) true color view of the area.
Primitive forest and jungle show up in dark green,
cultivated and pastured lands show up in light green and
reddish brown, barren and rocky lands show up in light
browns and tans. This image vividly shows how completely
this region has been converted to human cultivation. The
few dark-green patches in this image are all that remain
of the primitive forest that covered this entire area
only a few centuries ago. The mountain gorillas once
wandered through much of this area. They are now found
only in the Virunga Mountains and the Bwindi Primitive
Area in Uganda (upper center). Small patches of primitive
forest at lower center were connected with the Virungas
at the beginning of this century, but were cut off by
conversion of the forest to agricultural use several
decades ago. Gorillas no longer live in those small
patches. Given that the population of this area is still
doubling about every thirty years, it is apparent, even
from space, that new lands will be difficult to find for
the rising population. Virunga Region, TM bands
3-2-1 (download
TIFF) This image was created from spectral bands
recorded by a Landsat Thematic Mapper (TM). TM bands
differ slightly from MSS bands. The image was taken in
July 1989 and shows about the same region as the
Political Map above. The 3-2-1 combination of TM bands
produces a (nearly) true color view of the area.
Primitive forest and jungle show up in dark green,
cultivated and pastured lands show up in light green and
reddish brown, barren and rocky lands show up in light
browns and tans. This image vividly shows how completely
this region has been converted to human cultivation. The
few dark-green patches in this image are all that remain
of the primitive forest that covered this entire area
only a few centuries ago. The mountain gorillas once
wandered through much of this area. They are now found
only in the Virunga Mountains and the Bwindi Primitive
Area in Uganda (upper center). Small patches of primitive
forest at lower center were connected with the Virungas
at the beginning of this century, but were cut off by
conversion of the forest to agricultural use several
decades ago. Gorillas no longer live in those small
patches. Given that the population of this area is still
doubling about every thirty years, it is apparent, even
from space, that new lands will be difficult to find for
the rising population.
Notice also how incredibly hilly the
countryside is, even away from the heights of the
Virungas. Generally, individual hills are smooth,
rounded, and covered with soil, so they are used for
either crop growth or as cattle pastures. However,
because of the abundance of hills, about 70% of the land
available for agriculture has slopes greater than 5
degrees, and about 60% of the land used for grazing has
slopes greater than 10 degrees. These slopes are steeper
than the steepest sections of U.S. interstate highways.
Farming or running cattle over these steep slopes leads
to rapid erosion of the soil, and eventual loss of the
fertility of the land.
  Central Rwanda, TM bands
4-3-2 (download
TIFF) and TM
bands 7-4-2 (download
TIFF) These are two other representations of the '89
image. The 4-3-2 combination is similar to the MSS 3-2-1
combination, and the 7-4-2 combination is similar to the
2-4-1 MSS combination. Note how the prominence of the
haze decreases with increasing band number. These last
three images can be stacked.
Central Rwanda, TM bands
4-3-2 (download
TIFF) and TM
bands 7-4-2 (download
TIFF) These are two other representations of the '89
image. The 4-3-2 combination is similar to the MSS 3-2-1
combination, and the 7-4-2 combination is similar to the
2-4-1 MSS combination. Note how the prominence of the
haze decreases with increasing band number. These last
three images can be stacked.
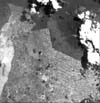 Virunga '89 West (download
TIFF) This gray-scale image shows the southwestern
border of the Virunga chain. Notice the very sharp edge
of the forest - there is no transition zone between the
primitive forest and the heavily populated farmlands. Two
different types of forest are apparent here, the lighter
gray blade-like strip of bamboo forest at the edge of the
cultivated area and the darker hagenia forests on the
higher slopes. The linear patterns in the cultivated
areas are vegetated terraces marking the boundaries of
the huge collective farms or "paysannants."
These large agricultural features were originally made by
European agricultural companies interested in growing pyrethrum, a natural
insecticide. They are now occupied by thousands of
families of native farmers. Virunga '89 West (download
TIFF) This gray-scale image shows the southwestern
border of the Virunga chain. Notice the very sharp edge
of the forest - there is no transition zone between the
primitive forest and the heavily populated farmlands. Two
different types of forest are apparent here, the lighter
gray blade-like strip of bamboo forest at the edge of the
cultivated area and the darker hagenia forests on the
higher slopes. The linear patterns in the cultivated
areas are vegetated terraces marking the boundaries of
the huge collective farms or "paysannants."
These large agricultural features were originally made by
European agricultural companies interested in growing pyrethrum, a natural
insecticide. They are now occupied by thousands of
families of native farmers.
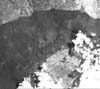 Virunga '89 Center (download
TIFF) This image shows the center of the Virunga
chain. The northern side of the remaining forest is in
Congo, the southern side is in Rwanda. Note the linear
pattern on the Rwandan side, indicating the presence of
more large agricultural projects, while the smaller,
irregular pattern on the Congolese side indicates
individual small-farm development. Virunga '89 Center (download
TIFF) This image shows the center of the Virunga
chain. The northern side of the remaining forest is in
Congo, the southern side is in Rwanda. Note the linear
pattern on the Rwandan side, indicating the presence of
more large agricultural projects, while the smaller,
irregular pattern on the Congolese side indicates
individual small-farm development.
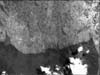 Virunga '89 Uganda (download
TIFF) This image shows the section of the Virunga
chain within the borders of Uganda. Compare the
agricultural patterns in Uganda with those of Congo and
Rwanda along the forest edge. This image was taken before
the Ugandan government forced hundreds of farmers to move
back down the mountainside closer to the original park
boundaries in 1992. Try comparing this image with the
same area in the April 1994 radar image below. Virunga '89 Uganda (download
TIFF) This image shows the section of the Virunga
chain within the borders of Uganda. Compare the
agricultural patterns in Uganda with those of Congo and
Rwanda along the forest edge. This image was taken before
the Ugandan government forced hundreds of farmers to move
back down the mountainside closer to the original park
boundaries in 1992. Try comparing this image with the
same area in the April 1994 radar image below.
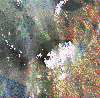
 April 1994 Synthetic Aperture
Radar (SAR) Image (download
TIFF) This NASA image was taken using the SIR-C/X-SAR
system aboard the Space Shuttle. It is a false color
image made from three radar bands. In this color scheme,
the primitive forests are in shades of green,
agricultural lands and bare rock show in shades of purple
and green, and water shows up black. The detail in this
image is somewhat better than the above Landsat images,
and there are no clouds at all because radar
"sees" through the clouds that so often are
present in this part of Africa. Image: Courtesy Jet Propulsion Laboratory.
Copyright © California Institute of Technology,
Pasadena, CA. All rights reserved. Based on
government-sponsored research under contract NAS7-1260. April 1994 Synthetic Aperture
Radar (SAR) Image (download
TIFF) This NASA image was taken using the SIR-C/X-SAR
system aboard the Space Shuttle. It is a false color
image made from three radar bands. In this color scheme,
the primitive forests are in shades of green,
agricultural lands and bare rock show in shades of purple
and green, and water shows up black. The detail in this
image is somewhat better than the above Landsat images,
and there are no clouds at all because radar
"sees" through the clouds that so often are
present in this part of Africa. Image: Courtesy Jet Propulsion Laboratory.
Copyright © California Institute of Technology,
Pasadena, CA. All rights reserved. Based on
government-sponsored research under contract NAS7-1260.
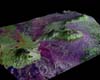 Perspective Radar Image This image shows the April 1994 radar image
draped over a three dimensional representation of the
Virunga Mountains. It provides an interesting
visualization of the Virungas. Note the locations and
orientation of the agricultural terracing and the
different vegetation zones on the slopes of the
volcanoes. This image was created by Dr. Scott Madry at
the Rutgers University Center for Remote Sensing and
Spatial Analysis. Similar images and animations can be
found at the Dian Fossey Gorilla Project web page at
Rutgers University. Perspective Radar Image This image shows the April 1994 radar image
draped over a three dimensional representation of the
Virunga Mountains. It provides an interesting
visualization of the Virungas. Note the locations and
orientation of the agricultural terracing and the
different vegetation zones on the slopes of the
volcanoes. This image was created by Dr. Scott Madry at
the Rutgers University Center for Remote Sensing and
Spatial Analysis. Similar images and animations can be
found at the Dian Fossey Gorilla Project web page at
Rutgers University.
 Virunga Vegetation (download
TIFF) This map was made by Dr. Scott Madry for the
Rutgers Gorilla Project. It shows the different types of
vegetation in the primitive rainforest on the Virunga
Mountains. Based on observations by Schaller (1963), the
mountain gorillas spend most of their time in the Hagenia
woodlands. During the few months of the year when new
bamboo shoots are growing, the gorillas spend part of
their time foraging in the bamboo forests. Virunga Vegetation (download
TIFF) This map was made by Dr. Scott Madry for the
Rutgers Gorilla Project. It shows the different types of
vegetation in the primitive rainforest on the Virunga
Mountains. Based on observations by Schaller (1963), the
mountain gorillas spend most of their time in the Hagenia
woodlands. During the few months of the year when new
bamboo shoots are growing, the gorillas spend part of
their time foraging in the bamboo forests.
 Virunga Base Map (color) (download
TIFF) This is the base map for the Local Scale
Virunga political map. It shows national boundaries, town
locations, etc., coded in different colors. This map can
be used to select features of interest to create base
maps for making overlays. Virunga Base Map (color) (download
TIFF) This is the base map for the Local Scale
Virunga political map. It shows national boundaries, town
locations, etc., coded in different colors. This map can
be used to select features of interest to create base
maps for making overlays.
 Virunga Base Map (b/w) (download
TIFF) This is a black and white version of the
Virunga Base Map. All of the features are black, rather
than color, because black lines show up more clearly in
certain composites and overlays than colored lines. Virunga Base Map (b/w) (download
TIFF) This is a black and white version of the
Virunga Base Map. All of the features are black, rather
than color, because black lines show up more clearly in
certain composites and overlays than colored lines.
[ Geographic &
Remote Sensing Information ]
[ Continental
Scale: East Africa ] [ Regional Scale: Rwanda &
Neighbors ]
[ Local Scale: The
Virguna Mountains ]
[ Remote Sensing/GIS
Activities ]
[ Glossary
] [ Related
Links ] [ References
] [ PBL
Model ]
[
Home
] [ Teacher
Pages ] [
Modules
& Activities ]
|